This is the English translation of the original German article Status der Schweizer Blogosphäre 2005.
Introduction
In this post I'm presenting you the state of the Swiss Blogosphere in the year 2005. In order to come up with this numbers and statistics I analyzed the blog.ch database. This report is part of a project I'm going to present in a few days. This report is of course inspired by David Sifry's "State of the Blogosphere" reports.
Weblogs
We don't have very precise numbers for the development of weblogs in Switzerland. Matthias only recently started to save the date of registration of the weblogs on blog.ch. So where it led to better results I used the date of the first known post on blog.ch to come up with a weblog creation date. This approach leads to quite reliable data for the year 2005.
Also the number of weblogs is probably quite a bit lower than the real number. The Swiss weblogs list knows about 1035 weblogs as of today. But German weblogs are over-represented which probably means, that many French and Italian weblogs are not currently listed. Compare these numbers:
- German weblogs: 736
- French weblogs: 137
- Italian weblogs: 12
The weblog list is a community project. So if you want to help out and add more weblogs, you are welcome to it.
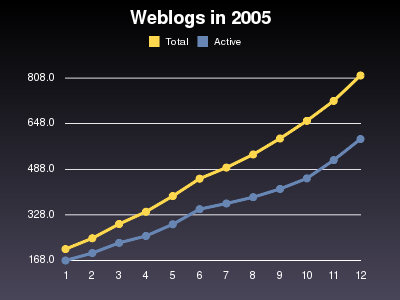
But let's get down to business now. The monthly numbers of weblogs are listed in the following table:
| Month | Weblogs | Active weblogs | Active % |
|---|---|---|---|
| 1/2005 | 208 | 168 | 80 % |
| 2/2005 | 246 | 194 | 78 % |
| 3/2005 | 296 | 230 | 77 % |
| 4/2005 | 339 | 254 | 74 % |
| 5/2005 | 394 | 295 | 74 % |
| 6/2005 | 455 | 348 | 76 % |
| 7/2005 | 494 | 368 | 74 % |
| 8/2005 | 540 | 390 | 72 % |
| 9/2005 | 596 | 419 | 70 % |
| 10/2005 | 658 | 456 | 69 % |
| 11/2005 | 728 | 520 | 71 % |
| 12/2005 | 817 | 594 | 72 % |

A weblog is counted as active, if a post was created in the past 30 days. This number of active weblogs is listed in the third column, while the fourth column shows how many percent of the known weblogs were active.
There were 186 known weblogs on January 1, 2005. This doubled to about 340 until mid-april and doubled again until October 22 when we knew about 673 weblogs. On December 31 we had 864 weblogs, 4.5 times as many as on January 1. So it's nothing like an exponential growth but it's solid enough. And a few days ago we hit 1000 weblogs in Switzerland.
The percentage of active weblogs has decreased quite a bit (from 80% to 72%). I imagine this number to drop down to 65 percent of maybe even lower. This is a natural development as people loose interest in their weblog and stop updating it. Also a few weblogs are opened for a single event such as a congress or a trip and are not updated after that.
Posts
Let's now have a look at the weblog posts in Switzerland. How many articles do the Swiss bloggers produce?
| Month | Daily average | Monthly total |
|---|---|---|
| 1/2005 | 118 | 3669 |
| 2/2005 | 131 | 3687 |
| 3/2005 | 145 | 4521 |
| 4/2005 | 168 | 5058 |
| 5/2005 | 196 | 6086 |
| 6/2005 | 241 | 7257 |
| 7/2005 | 227 | 7040 |
| 8/2005 | 247 | 7681 |
| 9/2005 | 279 | 8374 |
| 10/2005 | 271 | 8403 |
| 11/2005 | 305 | 9176 |
| 12/2005 | 315 | 9777 |
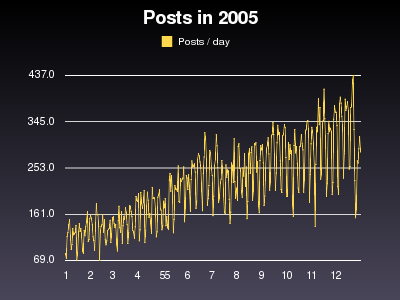
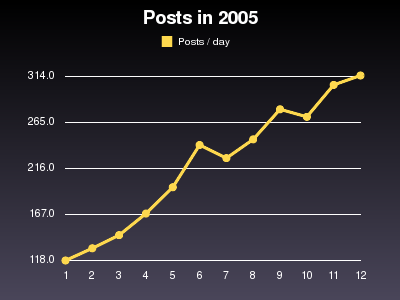
I created two different graphs for these numbers. One with 365 data points and the other with just 12. The first graph shows how posts vary a lot between the days of week. The second diagram is more suitable to read the growth. Both graphics show the number of posts per day.


This graphs show a simple message: the number of posts has clearly increased. But the growth is noticeably lower than the growth of the weblogs above. In January 208 weblogs contributed 118 posts per day, 0.6 posts per weblog on average. In December there were 315 posts per day from 817 weblogs, 0.4 on average. Even when we only count in the active weblogs, this ratio is similar (0.7 daily posts per weblog in January and 0.5 in December). I think this shows that weblogs are not updated as often as before. If you have other interpretations for this numbers, please comment.
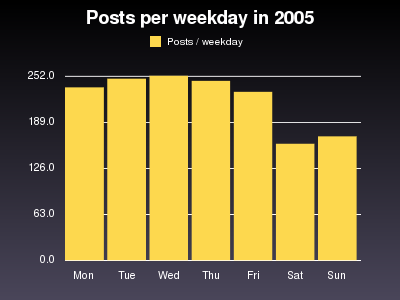
The graph of the daily posts clearly shows how the numbers vary between the days of the week. But how exactly does the distribution between the days of the week look? See the graph below:
Saturday is the day with the lowest number of posts, while most posts are created on Wednesday. But the differences on Monday to Friday are marginal. Apparently many people blog from work.
Closing words
As a new blogug.ch tool I am currently working on a project to collect numbers from the Swiss Blogosphere every day. This will allow us to easily have access to reliable numbers about weblogs in Switzerland. I will introduce that project in a few days, so stay tuned.